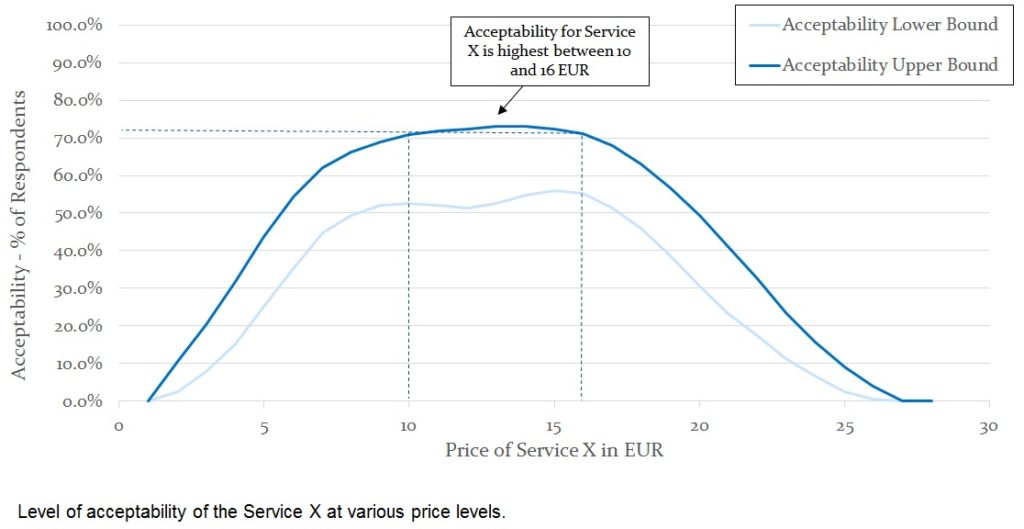
While the traditional VW chart is very popular, it is filled with criss-crossing lines that are not that easy to explain or understand, and it does not provide an immediate indication of the proportion of respondents that are interested in the product at various price point.
It is highly recommended to run a van Westendorp acceptability analysis which combines the information from the standard VW questions and provides an easy-to-read acceptability measure at each price point. The acceptability is defined by a lower and an upper value (see next slide).

The function advanced.VW available in R-sw Pricing provides the acceptability analysis as described above. In case the too cheap price point has not been included in the questionnaire, one can run the alternative function advanced.VW.missingTooCheap.
